Open data · DEFRA 2026 factors · ERA5 2023–2024 · built 2026-10-09Where could you go for a great holiday — with less carbon?
Three options for you

Best matchAswan, Egypt
23.2 °C average · 10.8 h sun · mostly dry
air ≈ 9h each way by air · 970 kg CO₂e return
Why: Best fit for your choices: averaging 23.2 °C with 10.8 h of sun a day, mostly dry.
But: Longer to reach: ≈ 9h each way by air.
Plan this trip →Photo: Vyacheslav Argenberg, CC BY 4.0 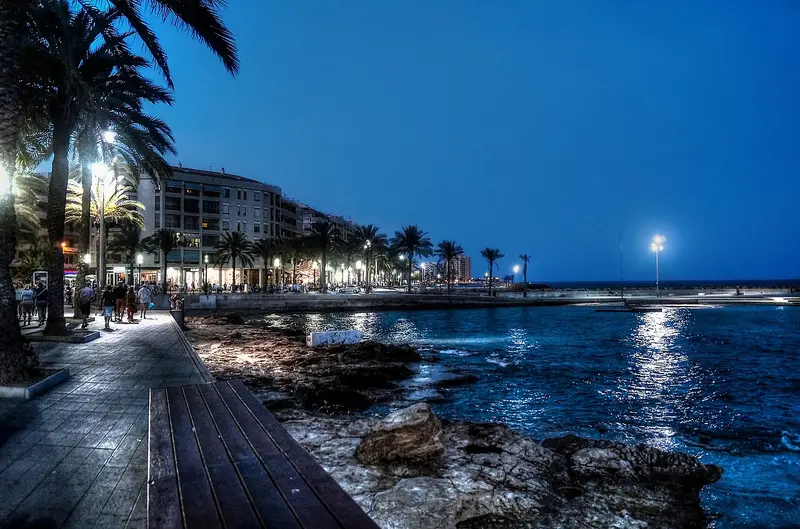
Quickest and lowest-carbonTorrevieja, Spain
17.3 °C average · 9.2 h sun · mostly dry · sea 18.2 °C
air ≈ 5h 30m each way by air · 379 kg CO₂e return
Why: Quickest and least carbon of the three: ≈ 5h 30m each way by air, 379 kg CO₂e return.
But: 5.9 °C cooler than the best match, averaging 17.3 °C.
Plan this trip →Photo: Jose M Martin Jimenez, CC BY-SA 2.0 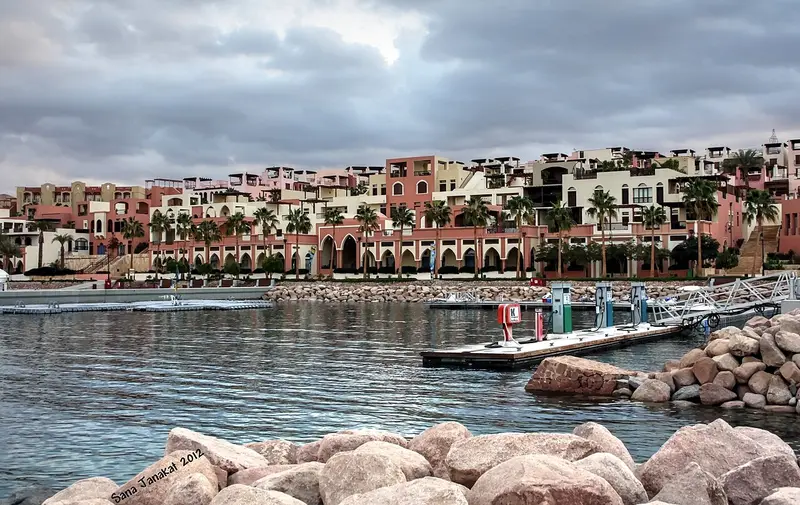
Another good matchAqaba, Jordan
22.3 °C average · 9.9 h sun · mostly dry · sea 25.3 °C
air ≈ 8h 30m each way by air · 886 kg CO₂e return
Why: Also fits your choices: averaging 22.3 °C with 9.9 h of sun a day.
But: Longer to reach: ≈ 8h 30m each way by air.
Plan this trip →Photo: Sana Janakat, CC BY-SA 4.0 Compare these side by side and send them to someone →
Among 503 well-known places with a page here. Weather is the historical daily mean for the month (2023–2024), across day and night; ≈ is a modelled journey time, ✓ a rail journey checked against a timetable. Places whose access could not be confirmed are never recommended. How it works.
International rail emits 0.01135 kg CO₂e per passenger-kilometre against 0.12576 for a short-haul economy flight — 11 times less. 0xCarbon applies the UK Government's 2026 emission factors to 2,723 destinations across 46 countries, then shows which ones give the most of what you actually want — warmth, sunshine — for the least carbon, from 32 departure cities across 16 countries in every month of the year. Where a destination has no measured climate it is left out rather than estimated: 0 candidates are held back for that reason.
Where is warm in the months ahead, from London
- Where is hot in November: Sharm el-Sheikh, Egypt, averaging 24.6 °C; without flying, Reus, averaging 14.3 °C by train.
- Where is hot in December: Sharm el-Sheikh, Egypt, averaging 20.4 °C; without flying, Reus, averaging 10.4 °C by train.
- Where is hot in January: Maspalomas, Spain, averaging 19.6 °C; without flying, Toulon, averaging 9.9 °C by train.
- Where is hot in February: Maspalomas, Spain, averaging 18.8 °C; without flying, Reus, averaging 10.5 °C by train.
Averages are historical daily means (2023–2024), across day and night. Warm in November from elsewhere in the UK: Manchester · Birmingham · Glasgow · Edinburgh · Bristol · Leeds.
Every departure city, in November
The tool above answers one city at a time. This is all 32 at once, in both questions, for November — the month the warmth question bites hardest — with journeys of up to 15 hours each way. Each destination is the best answer available from that city — nowhere else is both better and lower-carbon.
Warmest and sunniest reachable destination in November, by departure city, with the return CO₂e of getting there| From | Warmest | °C | kg CO₂e | Sunniest | h sun/day | kg CO₂e |
|---|
| Amsterdam | Safaga | 24.1 | 874 | Luxor | 10.6 | 882 |
|---|
| Barcelona | Sharm el-Sheikh | 24.6 | 824 | Luxor | 10.6 | 829 |
|---|
| Berlin | Sharm el-Sheikh | 24.6 | 814 | Luxor | 10.6 | 853 |
|---|
| Birmingham | Sharm el-Sheikh | 24.6 | 946 | Aswan | 10.8 | 1,008 |
|---|
| Bristol | Sharm el-Sheikh | 24.6 | 944 | Luxor | 10.6 | 965 |
|---|
| Brussels | Sharm el-Sheikh | 24.6 | 900 | Aswan | 10.8 | 901 |
|---|
| Cardiff | Sharm el-Sheikh | 24.6 | 953 | Luxor | 10.6 | 974 |
|---|
| Copenhagen | Sharm el-Sheikh | 24.6 | 891 | Luxor | 10.6 | 868 |
|---|
| Dublin | Sharm el-Sheikh | 24.6 | 1,017 | Aswan | 10.8 | 1,077 |
|---|
| Edinburgh | Sharm el-Sheikh | 24.6 | 1,008 | Aswan | 10.8 | 1,075 |
|---|
| Frankfurt | Sharm el-Sheikh | 24.6 | 826 | Luxor | 10.6 | 856 |
|---|
| Glasgow | Sharm el-Sheikh | 24.6 | 1,020 | Aswan | 10.8 | 1,087 |
|---|
| Leeds | Sharm el-Sheikh | 24.6 | 958 | Aswan | 10.8 | 1,023 |
|---|
| Lisbon | Sharm el-Sheikh | 24.6 | 977 | Luxor | 10.6 | 971 |
|---|
| Liverpool | Sharm el-Sheikh | 24.6 | 972 | Aswan | 10.8 | 1,035 |
|---|
| London | Sharm el-Sheikh | 24.6 | 909 | Luxor | 10.6 | 932 |
|---|
| Madrid | Sharm el-Sheikh | 24.6 | 873 | Luxor | 10.6 | 872 |
|---|
| Manchester | Sharm el-Sheikh | 24.6 | 963 | Luxor | 10.6 | 988 |
|---|
| Milan | Sharm el-Sheikh | 24.6 | 742 | Aswan | 10.8 | 803 |
|---|
| Munich | Sharm el-Sheikh | 24.6 | 750 | Luxor | 10.6 | 779 |
|---|
| Newcastle | Sharm el-Sheikh | 24.6 | 975 | Aswan | 10.8 | 1,041 |
|---|
| Nottingham | Sharm el-Sheikh | 24.6 | 942 | Luxor | 10.6 | 966 |
|---|
| Oslo | Sharm el-Sheikh | 24.6 | 932 | Luxor | 10.6 | 974 |
|---|
| Paris | Sharm el-Sheikh | 24.6 | 902 | Aswan | 10.8 | 897 |
|---|
| Prague | Sharm el-Sheikh | 24.6 | 751 | Luxor | 10.6 | 787 |
|---|
| Rome | Sharm el-Sheikh | 24.6 | 632 | Luxor | 10.6 | 648 |
|---|
| Sheffield | Sharm el-Sheikh | 24.6 | 952 | Luxor | 10.6 | 977 |
|---|
| Southampton | Sharm el-Sheikh | 24.6 | 920 | Luxor | 10.6 | 941 |
|---|
| Stockholm | Sharm el-Sheikh | 24.6 | 868 | Aswan | 10.8 | 957 |
|---|
| Vienna | Sharm el-Sheikh | 24.6 | 688 | Luxor | 10.6 | 724 |
|---|
| Warsaw | Sharm el-Sheikh | 24.6 | 735 | Aswan | 10.8 | 827 |
|---|
| Zurich | Sharm el-Sheikh | 24.6 | 782 | Luxor | 10.6 | 806 |
|---|
Every other month and journey length is precomputed too — browse by departure city.
Where every number comes from
Nothing on this site is an estimate of an estimate. Each column above has one published source and one vintage, and both are stated here so a figure can be checked without taking our word for it.
Source and vintage of every quantity 0xCarbon publishes| Quantity | Source | Detail and vintage |
|---|
| Temperature, sunshine, rainfall | ERA5 reanalysis, via Open-Meteo | Daily means over 2023–2024, averaged by calendar month. CC BY 4.0. |
|---|
| Sea temperature | NOAA OISST v2.1 | Every fifth day of 2023–2024, averaged by calendar month, at the nearest open sea within 25 km. Public domain. |
|---|
| CO₂e by air | UK Government (DESNZ/DEFRA) GHG conversion factors 2026 | 0.12576 short-haul, 0.11704 long-haul, 0.22928 UK domestic kg per passenger-km, radiative forcing included. OGL v3.0. |
|---|
| CO₂e by rail and ferry | UK Government (DESNZ/DEFRA) GHG conversion factors 2026 | 0.01135 international rail, 0.03092 UK national rail, 0.01871 foot-passenger ferry kg per passenger-km. OGL v3.0. |
|---|
| Journey time | Modelled here, not timetabled | Rail through 119 timetabled hubs, 1.1 h per change, within 8% of every journey checked on a real timetable; 750 km/h air plus 3.5 h airport overhead. Still the weakest part of the model. |
|---|
| Places, coordinates, population | GeoNames | Settlements over 20,000 people, at least 150 km away. CC BY 4.0. |
|---|
Every one of the 2,723 settlements that clear the size and distance filters carries twelve months of climate data, so none is excluded for want of it. The full method, including what it does badly, is written out separately.
What the numbers say
11×less CO₂e per passenger-kilometre on international rail than a short-haul economy flight, radiative forcing included
213kg CO₂e per extra degree, stepping from Sant Feliu de Guíxols to Sagunto in November — the steepest part of the curve
2,723destinations across 46 countries, each with twelve months of temperature, sunshine and rainfall
Warm is not the same as pleasant
A mild Atlantic winter can be relentlessly grey; a colder inland month can be bright and dry. Ranking on temperature alone sends people somewhere wet, so every table here carries sunshine hours and rainfall next to the degrees, and the site answers warmest, sunniest and coolest as separate questions.
Why the curve has a cliff
Within Europe, buying a better month is cheap in carbon terms: the extra distance is small and often on rails. Then the mainland runs out. The next improvement available is across open water, reachable only by air, and the price jumps by an order of magnitude. The cliff is not a quirk of the model — it is the shape of the map.
Then there is where you sleep
A journey is only part of a trip's carbon, and on a rail trip it is usually the smaller part. The same UK Government factor set prices a hotel room by country — a national average per occupied room, not any particular hotel — and across every frontier this site computes, 7 nights in one room outweighs one person's rail journey 81% of the time, by a median of 2.5×. Two sharing the room halve that share each; the journey does not halve. Take the train to Calais above — 4.5 kg — and 7 nights there adds 46.9 kg — 10.4× the journey itself. Fly to Sharm el-Sheikh and it inverts: 909 kg to arrive, 309 kg to stay the week.
Which is the point of putting it here. If you take the train, where you sleep becomes the biggest number in the trip — so it is worth choosing.
Hotel stay, kg CO₂e per occupied room-night, UK Government 2026 factors — every country in this dataset that DEFRA publishes one for| Country | kg CO₂e per night | 7 nights |
|---|
| Switzerland | 6.6 | 46.2 |
|---|
| France | 6.7 | 46.9 |
|---|
| Spain | 7.0 | 49.0 |
|---|
| United Kingdom | 10.4 | 72.8 |
|---|
| Belgium | 12.2 | 85.4 |
|---|
| Germany | 13.2 | 92.4 |
|---|
| Italy | 14.3 | 100 |
|---|
| The Netherlands | 14.8 | 104 |
|---|
| Portugal | 19.0 | 133 |
|---|
| Turkey | 32.1 | 225 |
|---|
| Egypt | 44.2 | 309 |
|---|
| Jordan | 68.9 | 482 |
|---|
DEFRA publishes hotel factors for 38 countries and no more, so Morocco, Greece, Poland and the Nordics have none. Where there is no factor the site says nothing rather than borrowing a neighbour's.
Where to stay in Sharm el-Sheikh
Places to stay in Sharm el-Sheikh, Egypt, on a live map. Prices and availability come from Stay22 and its booking partners.
Search places to stay in Sharm el-Sheikh →Opens the booking search in a new tab. Same partners as the map below.
Affiliate disclosure. A booking made through this map may earn 0xCarbon a commission, at no extra cost to you. It changes nothing above it: the emissions figures come from UK Government conversion factors and are computed before anyone is paid anything.See the method.
Quick answers for November
Start somewhere
Questions
How much less carbon does rail emit than flying?
International rail emits 0.01135 kg CO₂e per passenger-kilometre. A short-haul economy flight emits 0.12576 kg including radiative forcing — 11 times more. Both are UK Government (DESNZ/DEFRA) 2026 conversion factors.
Does accommodation emit more carbon than the journey?
On a rail journey, usually yes — for one person in one room. UK Government 2026 factors price a hotel room at 6.6 kg CO2e per night in Switzerland and 7 in Spain, so 7 nights is roughly 49 kg. Across every frontier 0xCarbon computes, 7 nights in one room outweighs one person's rail journey to reach it 81% of the time, by a median of 2.5 times. Flying inverts it: a return flight from London to the Canary Islands is 909 kg against about 49 kg for the week's stay. Share the room and the stay halves per person; the journey does not.
Is the warmest destination also the sunniest?
Usually not. Temperature and sunshine hours come apart, particularly on Atlantic coasts in winter, where mild weather is often overcast. 0xCarbon computes both separately and shows temperature, sunshine and rainfall side by side.
Use the data
Every figure here derives from published sources and the whole dataset is downloadable under CC BY 4.0. If you are writing about travel emissions or building something that needs them, take the data — attribution is all that is asked. The method is written out in full, including what it does badly.