Santiago de Compostela
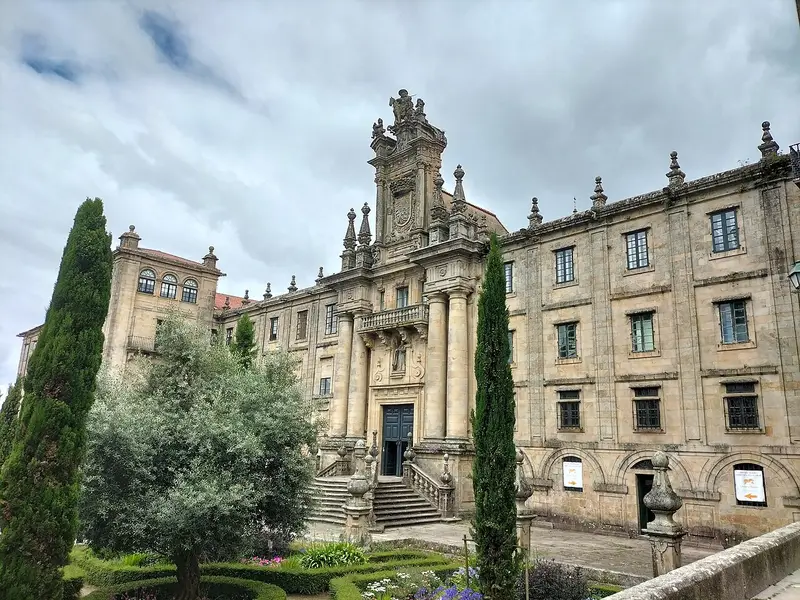
.jpg)
Reaching Santiago de Compostela from London emits 33.9 kg CO₂e return by rail (18h 48m each way) against 289 kg by air — 9× the carbon. It averages 20.7 °C in August and 8.8 °C in December.
Santiago de Compostela is the capital city of Galicia in northwest Spain. — Wikivoyage, CC BY-SA 4.0
When to go: Santiago de Compostela is warmest in August (20.7 °C), sunniest in July (12.0 h a day); coldest in December (8.8 °C). Month by month
Getting there
| From | Distance | By rail | Rail time | By air | Air time |
|---|---|---|---|---|---|
| Amsterdam | 1,454 km | 42.9 kg | 19h 12m | 366 kg | 5h 24m |
| Barcelona | 897 km | 26.5 kg | 8h 24m | 226 kg | 4h 42m |
| Berlin | 1,950 km | 57.5 kg | 24h 30m | 490 kg | 6h 6m |
| Birmingham | 1,177 km | 47.0 kg | 21h 30m | 296 kg | 5h 6m |
| Bristol | 1,053 km | 47.7 kg | 21h 48m | 265 kg | 4h 54m |
| Brussels | 1,318 km | 38.9 kg | 17h 18m | 332 kg | 5h 18m |
| Cardiff | 1,038 km | 50.9 kg | 22h 6m | 261 kg | 4h 54m |
| Copenhagen | 2,075 km | 61.2 kg | 30h | 522 kg | 6h 18m |
| Dublin | 1,175 km | — | — | 295 kg | 5h 6m |
| Edinburgh | 1,503 km | 76.8 kg | 24h 30m | 378 kg | 5h 30m |
| Frankfurt | 1,539 km | 45.4 kg | 19h 30m | 387 kg | 5h 36m |
| Glasgow | 1,476 km | 78.6 kg | 24h 42m | 371 kg | 5h 30m |
| Leeds | 1,318 km | 55.8 kg | 22h 24m | 332 kg | 5h 18m |
| Lisbon | 465 km | 13.7 kg | 8h 18m | 117 kg | 4h 6m |
| Liverpool | 1,241 km | 56.9 kg | 22h 24m | 312 kg | 5h 12m |
| London | 1,149 km | 33.9 kg | 18h 48m | 289 kg | 5h |
| Madrid | 487 km | 14.4 kg | 4h 48m | 122 kg | 4h 6m |
| Manchester | 1,267 km | 55.0 kg | 22h 18m | 319 kg | 5h 12m |
| Milan | 1,440 km | 42.5 kg | 21h 42m | 362 kg | 5h 24m |
| Munich | 1,667 km | 49.2 kg | 21h 36m | 419 kg | 5h 42m |
| Newcastle | 1,435 km | 65.9 kg | 23h | 361 kg | 5h 24m |
| Nottingham | 1,247 km | 48.0 kg | 21h 54m | 314 kg | 5h 12m |
| Oslo | 2,300 km | 67.9 kg | 35h 12m | 579 kg | 6h 36m |
| Paris | 1,072 km | 31.6 kg | 14h 24m | 270 kg | 4h 54m |
| Prague | 1,922 km | 56.7 kg | 28h 24m | 484 kg | 6h 6m |
| Rome | 1,728 km | 51.0 kg | 25h 42m | 435 kg | 5h 48m |
| Sheffield | 1,279 km | 52.2 kg | 22h 12m | 322 kg | 5h 12m |
| Southampton | 1,043 km | 42.9 kg | 21h 30m | 262 kg | 4h 54m |
| Stockholm | 2,574 km | 76.0 kg | 36h 24m | 648 kg | 6h 54m |
| Vienna | 2,019 km | 59.6 kg | 26h 42m | 508 kg | 6h 12m |
| Warsaw | 2,427 km | 71.6 kg | 32h | 611 kg | 6h 42m |
| Zurich | 1,427 km | 42.1 kg | 19h 54m | 359 kg | 5h 24m |
The year in Santiago de Compostela
| Jan | Feb | Mar | Apr | May | Jun | Jul | Aug | Sep | Oct | Nov | Dec | |
|---|---|---|---|---|---|---|---|---|---|---|---|---|
| Temp °C | 8.9 | 9.3 | 10.5 | 13.1 | 14.7 | 18.0 | 19.3 | 20.7 | 17.6 | 16.1 | 13.0 | 8.8 |
| Sun h/day | 5.1 | 7.8 | 6.9 | 9.8 | 10.7 | 11.6 | 12.0 | 11.1 | 9.1 | 6.1 | 6.0 | 5.7 |
| Rain mm/day | 6.7 | 3.7 | 6.1 | 2.9 | 3.9 | 3.6 | 1.6 | 0.6 | 3.9 | 12.2 | 6.6 | 4.6 |
When to go
Santiago de Compostela is warmest in August at 20.7 °C but brightest in July, averaging 12.0 hours of sun a day — the two do not always coincide, which is worth knowing before booking. Its coldest is December at 8.8 °C.
Three months worth booking
The same year of measurements, decided rather than tabulated. Each opens the map below on dates in that month.
Staying there
A hotel room in Spain emits about 7 kg CO₂e per night under UK Government 2026 factors — a country average per occupied room, not this or any particular hotel. 7 nights in one room adds roughly 49 kg — about 3.6× the carbon of one person getting there by rail from Lisbon. Two sharing the room halve that share each; the journey does not halve.
How busy it gets
A Coruña records 4.9 overnight stays per resident a year (5,560,712 nights in 2024). Comparatively quiet by European standards.
Eurostat, nights spent at tourist accommodation by NUTS 3 region, against resident population. Shown for context only — it plays no part in which destinations appear or in what order. Eurostat does not cover the United Kingdom after 2016, nor North Africa or the Levant at all, so this figure is absent for roughly a third of the destinations here.
Where to stay in Santiago de Compostela
Places to stay in Santiago de Compostela, Spain, on a live map. Prices and availability come from Stay22 and its booking partners.
Search places to stay in Santiago de Compostela →Opens the booking search in a new tab. Same partners as the map below.
Affiliate disclosure. A booking made through this map may earn 0xCarbon a commission, at no extra cost to you. It changes nothing above it: the emissions figures come from UK Government conversion factors and are computed before anyone is paid anything.See the method.
Distances are great-circle. Rail assumes international rail at 0.01135 kg CO₂e per passenger-km with a 1.3× track detour allowance; flights use 0.12576 kg per passenger-km including radiative forcing. Journey times are modelled, not timetabled. Full method.