Rome
.jpg)
Reaching Rome from London emits 42.4 kg CO₂e return by rail (16h 54m each way) against 361 kg by air — 9× the carbon. It averages 28.0 °C in July and 8.8 °C in January.
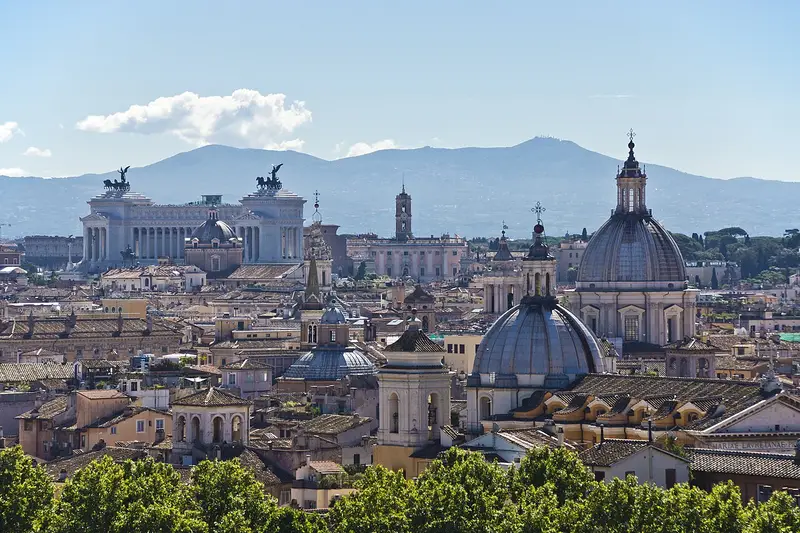
Rome (Italian and Latin: Roma), the 'Eternal City', is the capital and largest city of Italy and of the Lazio region. — Wikivoyage, CC BY-SA 4.0
When to go: Rome is warmest in July (28.0 °C); coldest in January (8.8 °C). Month by month
Getting there
| From | Distance | By rail | Rail time | By air | Air time |
|---|---|---|---|---|---|
| Amsterdam | 1,299 km | 38.3 kg | 17h 12m | 327 kg | 5h 12m |
| Barcelona | 862 km | 25.4 kg | 14h 30m | 217 kg | 4h 36m |
| Berlin | 1,184 km | 34.9 kg | 16h 30m | 298 kg | 5h 6m |
| Birmingham | 1,598 km | 55.4 kg | 19h 36m | 402 kg | 5h 36m |
| Bristol | 1,563 km | 56.1 kg | 19h 54m | 393 kg | 5h 36m |
| Brussels | 1,175 km | 34.7 kg | 15h 18m | 296 kg | 5h 6m |
| Cardiff | 1,597 km | 59.3 kg | 20h 6m | 402 kg | 5h 36m |
| Copenhagen | 1,533 km | 45.2 kg | 24h 6m | 386 kg | 5h 30m |
| Dublin | 1,886 km | — | — | 474 kg | 6h |
| Edinburgh | 1,930 km | 85.3 kg | 22h 36m | 485 kg | 6h 6m |
| Frankfurt | 961 km | 28.3 kg | 14h 48m | 242 kg | 4h 48m |
| Glasgow | 1,968 km | 87.0 kg | 22h 48m | 495 kg | 6h 6m |
| Leeds | 1,683 km | 64.2 kg | 20h 30m | 423 kg | 5h 42m |
| Lisbon | 1,865 km | 55.0 kg | 28h 54m | 469 kg | 6h |
| Liverpool | 1,721 km | 65.4 kg | 20h 30m | 433 kg | 5h 48m |
| London | 1,435 km | 42.4 kg | 16h 54m | 361 kg | 5h 24m |
| Madrid | 1,365 km | 40.3 kg | 17h 36m | 343 kg | 5h 18m |
| Manchester | 1,690 km | 63.4 kg | 20h 24m | 425 kg | 5h 48m |
| Milan | 479 km | 14.1 kg | 4h 24m | 120 kg | 4h 6m |
| Munich | 698 km | 20.6 kg | 12h 6m | 176 kg | 4h 24m |
| Newcastle | 1,782 km | 74.3 kg | 21h 6m | 448 kg | 5h 54m |
| Nottingham | 1,597 km | 56.4 kg | 19h 54m | 402 kg | 5h 36m |
| Oslo | 2,007 km | 59.2 kg | 31h | 505 kg | 6h 12m |
| Paris | 1,107 km | 32.7 kg | 12h 30m | 278 kg | 5h |
| Prague | 923 km | 27.2 kg | 15h 18m | 232 kg | 4h 42m |
| Sheffield | 1,646 km | 60.6 kg | 20h 12m | 414 kg | 5h 42m |
| Southampton | 1,459 km | 51.3 kg | 19h 36m | 367 kg | 5h 24m |
| Stockholm | 1,977 km | 58.3 kg | 29h 6m | 497 kg | 6h 6m |
| Vienna | 765 km | 22.6 kg | 13h | 192 kg | 4h 30m |
| Warsaw | 1,316 km | 38.8 kg | 20h 24m | 331 kg | 5h 18m |
| Zurich | 685 km | 20.2 kg | 8h 48m | 172 kg | 4h 24m |
The year in Rome
| Jan | Feb | Mar | Apr | May | Jun | Jul | Aug | Sep | Oct | Nov | Dec | |
|---|---|---|---|---|---|---|---|---|---|---|---|---|
| Temp °C | 8.8 | 9.3 | 12.2 | 14.0 | 17.9 | 22.9 | 28.0 | 27.1 | 22.3 | 19.3 | 13.1 | 9.2 |
| Sun h/day | 7.0 | 8.2 | 9.2 | 11.3 | 10.8 | 13.3 | 13.9 | 12.8 | 10.8 | 8.5 | 7.7 | 7.1 |
| Rain mm/day | 2.6 | 2.3 | 3.3 | 1.9 | 3.9 | 2.1 | 0.4 | 1.7 | 2.6 | 3.7 | 3.0 | 1.9 |
When to go
Rome is warmest in July at 28.0 °C, and that is also its brightest month. Its coldest is January at 8.8 °C.
Three months worth booking
The same year of measurements, decided rather than tabulated. Each opens the map below on dates in that month.
Staying there
A hotel room in Italy emits about 14.3 kg CO₂e per night under UK Government 2026 factors — a country average per occupied room, not this or any particular hotel. 7 nights in one room adds roughly 100 kg — about 7.1× the carbon of one person getting there by rail from Milan. Two sharing the room halve that share each; the journey does not halve.
How busy it gets
Roma records 13.3 overnight stays per resident a year (56,002,908 nights in 2025). A well-visited region, busy in season but not overwhelmed.
Eurostat, nights spent at tourist accommodation by NUTS 3 region, against resident population. Shown for context only — it plays no part in which destinations appear or in what order. Eurostat does not cover the United Kingdom after 2016, nor North Africa or the Levant at all, so this figure is absent for roughly a third of the destinations here.
Where to stay in Rome
Places to stay in Rome, Italy, on a live map. Prices and availability come from Stay22 and its booking partners.
Search places to stay in Rome →Opens the booking search in a new tab. Same partners as the map below.
Affiliate disclosure. A booking made through this map may earn 0xCarbon a commission, at no extra cost to you. It changes nothing above it: the emissions figures come from UK Government conversion factors and are computed before anyone is paid anything.See the method.
Distances are great-circle. Rail assumes international rail at 0.01135 kg CO₂e per passenger-km with a 1.3× track detour allowance; flights use 0.12576 kg per passenger-km including radiative forcing. Journey times are modelled, not timetabled. Full method.