Fnidek
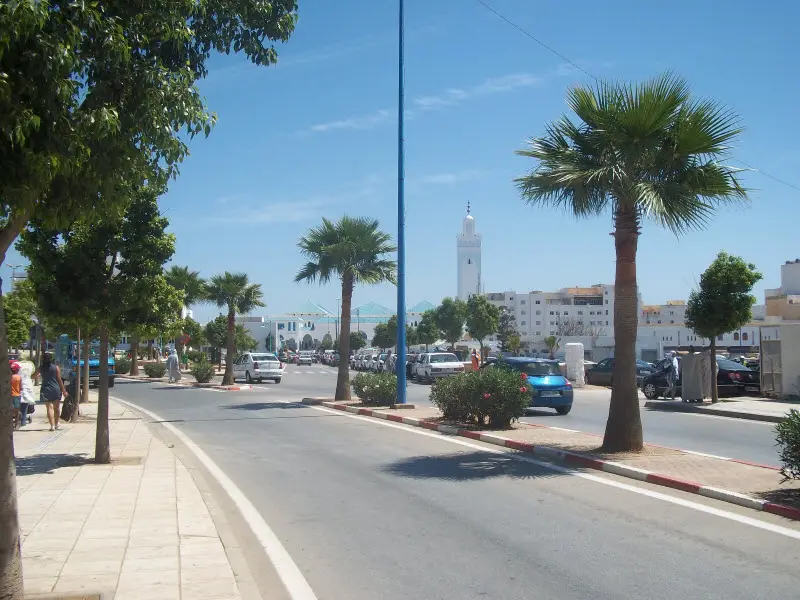

Fnidek is not costed by rail here: no through rail connection is modelled, and no verified rail or sea itinerary is included in this comparison. By air it is 450 kg CO₂e return from London. It averages 24.7 °C in August and 14.4 °C in January.
When to go: Fnidek is warmest in August (24.7 °C), sunniest in July (12.7 h a day); coldest in January (14.4 °C). Month by month
Getting there
| From | Distance | By rail | Rail time | By air | Air time |
|---|---|---|---|---|---|
| Amsterdam | 2,007 km | — | — | 505 kg | 6h 12m |
| Barcelona | 897 km | — | — | 226 kg | 4h 42m |
| Berlin | 2,368 km | — | — | 596 kg | 6h 42m |
| Birmingham | 1,869 km | — | — | 470 kg | 6h |
| Bristol | 1,749 km | — | — | 440 kg | 5h 48m |
| Brussels | 1,840 km | — | — | 463 kg | 6h |
| Cardiff | 1,747 km | — | — | 439 kg | 5h 48m |
| Copenhagen | 2,589 km | — | — | 651 kg | 7h |
| Dublin | 1,945 km | — | — | 489 kg | 6h 6m |
| Edinburgh | 2,241 km | — | — | 564 kg | 6h 30m |
| Frankfurt | 1,948 km | — | — | 490 kg | 6h 6m |
| Glasgow | 2,227 km | — | — | 560 kg | 6h 30m |
| Leeds | 2,017 km | — | — | 507 kg | 6h 12m |
| Lisbon | 463 km | — | — | 117 kg | 4h 6m |
| Liverpool | 1,962 km | — | — | 493 kg | 6h 6m |
| London | 1,790 km | — | — | 450 kg | 5h 54m |
| Madrid | 528 km | — | — | 133 kg | 4h 12m |
| Manchester | 1,976 km | — | — | 497 kg | 6h 6m |
| Milan | 1,623 km | — | — | 408 kg | 5h 42m |
| Munich | 1,948 km | — | — | 490 kg | 6h 6m |
| Newcastle | 2,146 km | — | — | 540 kg | 6h 24m |
| Nottingham | 1,930 km | — | — | 486 kg | 6h 6m |
| Oslo | 2,915 km | — | — | 733 kg | 7h 24m |
| Paris | 1,577 km | — | — | 397 kg | 5h 36m |
| Prague | 2,244 km | — | — | 565 kg | 6h 30m |
| Rome | 1,682 km | — | — | 423 kg | 5h 42m |
| Sheffield | 1,973 km | — | — | 496 kg | 6h 6m |
| Southampton | 1,704 km | — | — | 429 kg | 5h 48m |
| Stockholm | 3,111 km | — | — | 783 kg | 7h 36m |
| Vienna | 2,247 km | — | — | 565 kg | 6h 30m |
| Warsaw | 2,758 km | — | — | 694 kg | 7h 12m |
| Zurich | 1,720 km | — | — | 433 kg | 5h 48m |
The year in Fnidek
| Jan | Feb | Mar | Apr | May | Jun | Jul | Aug | Sep | Oct | Nov | Dec | |
|---|---|---|---|---|---|---|---|---|---|---|---|---|
| Temp °C | 14.4 | 14.5 | 15.4 | 17.4 | 18.6 | 21.1 | 24.1 | 24.7 | 21.9 | 20.1 | 17.6 | 15.0 |
| Sun h/day | 8.1 | 8.5 | 9.0 | 11.6 | 11.8 | 12.4 | 12.7 | 12.1 | 10.8 | 8.8 | 8.3 | 8.3 |
| Rain mm/day | 2.1 | 2.7 | 4.5 | 0.4 | 1.3 | 1.4 | 0.0 | 0.1 | 2.1 | 3.0 | 0.7 | 0.9 |
| Sea °C | 17.5 | 16.2 | 16.3 | 17.4 | 18.2 | 20.1 | 22.0 | 22.5 | 22.0 | 20.4 | 19.1 | 18.0 |
When to go
Fnidek is warmest in August at 24.7 °C but brightest in July, averaging 12.7 hours of sun a day — the two do not always coincide, which is worth knowing before booking. Its coldest is January at 14.4 °C.
Three months worth booking
The same year of measurements, decided rather than tabulated. Each opens the map below on dates in that month.
Where to stay in Fnidek
Places to stay in Fnidek, Morocco, on a live map. Prices and availability come from Stay22 and its booking partners.
Search places to stay in Fnidek →Opens the booking search in a new tab. Same partners as the map below.
Affiliate disclosure. A booking made through this map may earn 0xCarbon a commission, at no extra cost to you. It changes nothing above it: the emissions figures come from UK Government conversion factors and are computed before anyone is paid anything.See the method.
Distances are great-circle. Rail assumes international rail at 0.01135 kg CO₂e per passenger-km with a 1.3× track detour allowance; flights use 0.12576 kg per passenger-km including radiative forcing. Journey times are modelled, not timetabled. Full method.