Zadar
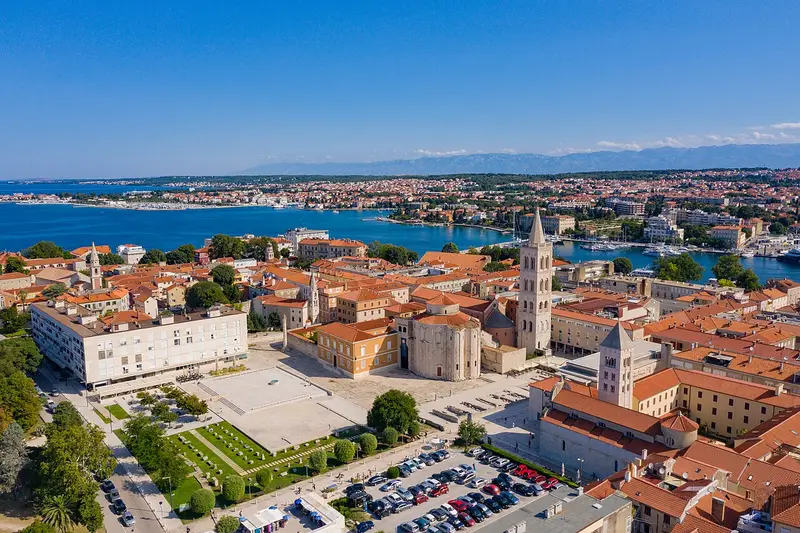

Reaching Zadar from London emits 41.5 kg CO₂e return by rail (22h 30m each way) against 354 kg by air — 9× the carbon. It averages 26.2 °C in July and 7.8 °C in January.
Zadar is the biggest city, cultural, economic and transit center of northern Dalmatia and the oldest continuously inhabited city in Croatia. — Wikivoyage, CC BY-SA 4.0
When to go: Zadar is warmest in July (26.2 °C); coldest in January (7.8 °C). Month by month
Getting there
| From | Distance | By rail | Rail time | By air | Air time |
|---|---|---|---|---|---|
| Amsterdam | 1,193 km | 35.2 kg | 22h 54m | 300 kg | 5h 6m |
| Barcelona | 1,108 km | 32.7 kg | 23h 24m | 279 kg | 5h |
| Berlin | 944 km | 27.9 kg | 18h 54m | 238 kg | 4h 48m |
| Birmingham | 1,565 km | 54.6 kg | 25h 18m | 394 kg | 5h 36m |
| Bristol | 1,556 km | 55.2 kg | 25h 30m | 391 kg | 5h 36m |
| Brussels | 1,106 km | 32.7 kg | 21h | 278 kg | 5h |
| Cardiff | 1,594 km | 58.5 kg | 25h 48m | 401 kg | 5h 36m |
| Copenhagen | 1,299 km | 38.3 kg | 27h | 327 kg | 5h 12m |
| Dublin | 1,868 km | — | — | 470 kg | 6h |
| Edinburgh | 1,850 km | 84.4 kg | 28h 18m | 465 kg | 6h |
| Frankfurt | 830 km | 24.5 kg | 18h 30m | 209 kg | 4h 36m |
| Glasgow | 1,897 km | 86.1 kg | 28h 24m | 477 kg | 6h |
| Leeds | 1,623 km | 63.4 kg | 26h 6m | 408 kg | 5h 42m |
| Lisbon | 2,110 km | 62.3 kg | 40h 54m | 531 kg | 6h 18m |
| Liverpool | 1,679 km | 64.5 kg | 26h 6m | 422 kg | 5h 42m |
| London | 1,406 km | 41.5 kg | 22h 30m | 354 kg | 5h 24m |
| Madrid | 1,607 km | 47.4 kg | 27h | 404 kg | 5h 36m |
| Manchester | 1,642 km | 62.5 kg | 26h | 413 kg | 5h 42m |
| Milan | 499 km | 14.7 kg | 10h 6m | 126 kg | 4h 12m |
| Munich | 528 km | 15.6 kg | 14h 30m | 133 kg | 4h 12m |
| Newcastle | 1,704 km | 73.5 kg | 26h 48m | 429 kg | 5h 48m |
| Nottingham | 1,549 km | 55.6 kg | 25h 36m | 390 kg | 5h 36m |
| Oslo | 1,782 km | 52.6 kg | 36h 36m | 448 kg | 5h 54m |
| Paris | 1,116 km | 32.9 kg | 18h 12m | 281 kg | 5h |
| Prague | 667 km | 19.7 kg | 17h 30m | 168 kg | 4h 24m |
| Rome | 331 km | 9.8 kg | 9h 18m | 83.4 kg | 3h 54m |
| Sheffield | 1,593 km | 59.8 kg | 25h 54m | 401 kg | 5h 36m |
| Southampton | 1,454 km | 50.4 kg | 25h 12m | 366 kg | 5h 24m |
| Stockholm | 1,703 km | 50.2 kg | 33h 24m | 428 kg | 5h 48m |
| Vienna | 464 km | 13.7 kg | 12h 48m | 117 kg | 4h 6m |
| Warsaw | 998 km | 29.5 kg | 20h 30m | 251 kg | 4h 48m |
| Zurich | 631 km | 18.6 kg | 14h 30m | 159 kg | 4h 18m |
The year in Zadar
| Jan | Feb | Mar | Apr | May | Jun | Jul | Aug | Sep | Oct | Nov | Dec | |
|---|---|---|---|---|---|---|---|---|---|---|---|---|
| Temp °C | 7.8 | 8.5 | 11.2 | 13.2 | 18.1 | 22.4 | 26.2 | 26.1 | 21.4 | 18.1 | 11.7 | 8.4 |
| Sun h/day | 6.5 | 7.7 | 8.7 | 10.9 | 11.7 | 12.8 | 13.7 | 12.8 | 10.1 | 8.6 | 6.6 | 5.5 |
| Rain mm/day | 4.2 | 3.1 | 4.8 | 2.8 | 4.4 | 2.8 | 1.6 | 3.3 | 4.8 | 5.6 | 6.5 | 3.9 |
When to go
Zadar is warmest in July at 26.2 °C, and that is also its brightest month. Its coldest is January at 7.8 °C.
Three months worth booking
The same year of measurements, decided rather than tabulated. Each opens the map below on dates in that month.
Where to stay in Zadar
Places to stay in Zadar, Croatia, on a live map. Prices and availability come from Stay22 and its booking partners.
Search places to stay in Zadar →Opens the booking search in a new tab. Same partners as the map below.
Affiliate disclosure. A booking made through this map may earn 0xCarbon a commission, at no extra cost to you. It changes nothing above it: the emissions figures come from UK Government conversion factors and are computed before anyone is paid anything.See the method.
Distances are great-circle. Rail assumes international rail at 0.01135 kg CO₂e per passenger-km with a 1.3× track detour allowance; flights use 0.12576 kg per passenger-km including radiative forcing. Journey times are modelled, not timetabled. Full method.