Molde

Reaching Molde from London emits 39.0 kg CO₂e return by rail (23h 54m each way) against 333 kg by air — 9× the carbon. It averages 14.6 °C in July and 0.2 °C in December.
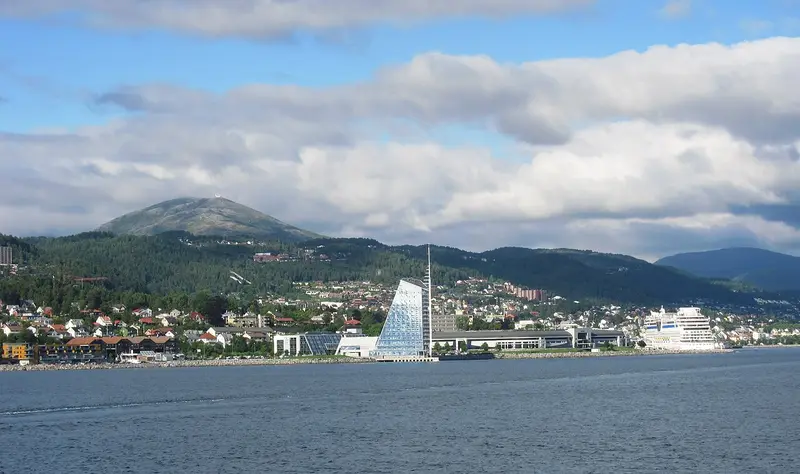
Molde is a town in Møre og Romsdal situated at the north shore of the Molde Fjord where it enjoys one of the best locations in Norway. — Wikivoyage, CC BY-SA 4.0
When to go: Molde is warmest in July (14.6 °C), sunniest in May (10.6 h a day); coldest in December (0.2 °C). Month by month
Getting there
| From | Distance | By rail | Rail time | By air | Air time |
|---|---|---|---|---|---|
| Amsterdam | 1,160 km | 34.2 kg | 18h 42m | 292 kg | 5h |
| Barcelona | 2,397 km | 70.7 kg | 30h 48m | 603 kg | 6h 42m |
| Berlin | 1,194 km | 35.2 kg | 19h 12m | 300 kg | 5h 6m |
| Birmingham | 1,259 km | 52.1 kg | 26h 36m | 317 kg | 5h 12m |
| Bristol | 1,383 km | 52.8 kg | 26h 54m | 348 kg | 5h 18m |
| Brussels | 1,332 km | 39.3 kg | 21h 12m | 335 kg | 5h 18m |
| Cardiff | 1,395 km | 56.0 kg | 27h 12m | 351 kg | 5h 24m |
| Copenhagen | 843 km | 24.9 kg | 14h 12m | 212 kg | 4h 36m |
| Dublin | 1,305 km | — | — | 328 kg | 5h 12m |
| Edinburgh | 954 km | 81.9 kg | 29h 36m | 240 kg | 4h 48m |
| Frankfurt | 1,407 km | 41.5 kg | 21h 6m | 354 kg | 5h 24m |
| Glasgow | 999 km | 83.7 kg | 29h 48m | 251 kg | 4h 48m |
| Leeds | 1,115 km | 60.9 kg | 27h 30m | 280 kg | 5h |
| Lisbon | 2,887 km | 85.2 kg | 43h 18m | 726 kg | 7h 18m |
| Liverpool | 1,193 km | 62.0 kg | 27h 30m | 300 kg | 5h 6m |
| London | 1,322 km | 39.0 kg | 23h 54m | 333 kg | 5h 18m |
| Madrid | 2,585 km | 76.3 kg | 34h 24m | 650 kg | 6h 54m |
| Manchester | 1,165 km | 60.1 kg | 27h 24m | 293 kg | 5h 6m |
| Milan | 1,925 km | 56.8 kg | 29h 48m | 484 kg | 6h 6m |
| Munich | 1,646 km | 48.6 kg | 23h 42m | 414 kg | 5h 42m |
| Newcastle | 998 km | 71.0 kg | 28h 6m | 251 kg | 4h 48m |
| Nottingham | 1,192 km | 53.1 kg | 27h | 300 kg | 5h 6m |
| Oslo | 368 km | 10.9 kg | 6h 48m | 92.5 kg | 4h |
| Paris | 1,572 km | 46.4 kg | 22h 42m | 395 kg | 5h 36m |
| Prague | 1,474 km | 43.5 kg | 23h 18m | 371 kg | 5h 30m |
| Rome | 2,344 km | 69.2 kg | 33h 18m | 590 kg | 6h 36m |
| Sheffield | 1,155 km | 57.3 kg | 27h 18m | 291 kg | 5h |
| Southampton | 1,412 km | 48.0 kg | 26h 36m | 355 kg | 5h 24m |
| Stockholm | 698 km | 20.6 kg | 12h 6m | 176 kg | 4h 24m |
| Vienna | 1,713 km | 50.5 kg | 26h 48m | 431 kg | 5h 48m |
| Warsaw | 1,426 km | 42.1 kg | 22h 6m | 359 kg | 5h 24m |
| Zurich | 1,711 km | 50.5 kg | 26h 42m | 430 kg | 5h 48m |
The year in Molde
| Jan | Feb | Mar | Apr | May | Jun | Jul | Aug | Sep | Oct | Nov | Dec | |
|---|---|---|---|---|---|---|---|---|---|---|---|---|
| Temp °C | 1.0 | 1.6 | 1.9 | 5.5 | 11.4 | 13.1 | 14.6 | 14.5 | 11.9 | 6.3 | 1.8 | 0.2 |
| Sun h/day | 1.3 | 3.2 | 6.4 | 9.3 | 10.6 | 10.2 | 10.0 | 7.3 | 6.6 | 3.9 | 2.8 | 0.8 |
| Rain mm/day | 6.1 | 6.4 | 3.5 | 2.7 | 3.8 | 3.7 | 4.9 | 6.7 | 7.8 | 10.4 | 5.1 | 7.5 |
| Sea °C | 6.7 | 6.0 | 5.4 | 6.3 | 8.7 | 11.3 | 14.1 | 15.1 | 14.5 | 12.1 | 9.8 | 7.8 |
When to go
Molde is warmest in July at 14.6 °C but brightest in May, averaging 10.6 hours of sun a day — the two do not always coincide, which is worth knowing before booking. Its coldest is December at 0.2 °C.
Three months worth booking
The same year of measurements, decided rather than tabulated. Each opens the map below on dates in that month.
Where to stay in Molde
Places to stay in Molde, Norway, on a live map. Prices and availability come from Stay22 and its booking partners.
Search places to stay in Molde →Opens the booking search in a new tab. Same partners as the map below.
Affiliate disclosure. A booking made through this map may earn 0xCarbon a commission, at no extra cost to you. It changes nothing above it: the emissions figures come from UK Government conversion factors and are computed before anyone is paid anything.See the method.
Distances are great-circle. Rail assumes international rail at 0.01135 kg CO₂e per passenger-km with a 1.3× track detour allowance; flights use 0.12576 kg per passenger-km including radiative forcing. Journey times are modelled, not timetabled. Full method.