Milton Keynes

Reaching Milton Keynes from Sheffield emits 12.6 kg CO₂e return by rail (3h 48m each way) against 71.8 kg by air — 6× the carbon. It averages 16.9 °C in August and 4.5 °C in January.
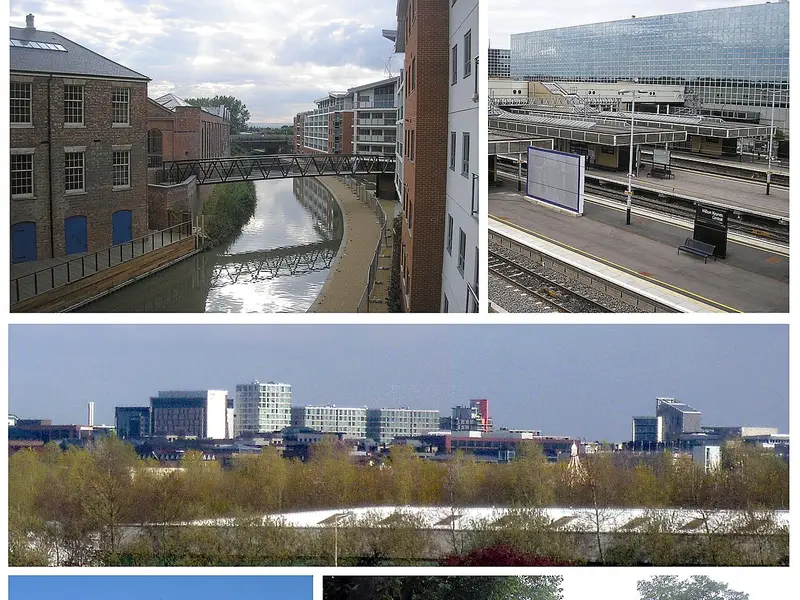
Milton Keynes is a city of 245,000 people (2019) in the South East of England. — Wikivoyage, CC BY-SA 4.0
When to go: Milton Keynes is warmest in August (16.9 °C), sunniest in June (12.1 h a day); coldest in January (4.5 °C). Month by month
Getting there
| From | Distance | By rail | Rail time | By air | Air time |
|---|---|---|---|---|---|
| Amsterdam | 386 km | 16.4 kg | 8h | 97.2 kg | 4h |
| Barcelona | 1,205 km | 39.5 kg | 14h 24m | 303 kg | 5h 6m |
| Berlin | 964 km | 33.4 kg | 14h 18m | 242 kg | 4h 48m |
| Brussels | 378 km | 15.4 kg | 6h 6m | 95.0 kg | 4h |
| Cardiff | 178 km | 14.3 kg | 4h 6m | 81.7 kg | 3h 42m |
| Copenhagen | 961 km | 34.1 kg | 19h 54m | 242 kg | 4h 48m |
| Dublin | 397 km | — | — | 99.9 kg | 4h |
| Edinburgh | 463 km | 37.2 kg | 7h 48m | 212 kg | 4h 6m |
| Frankfurt | 693 km | 24.7 kg | 10h 12m | 174 kg | 4h 24m |
| Glasgow | 483 km | 38.8 kg | 7h 54m | 221 kg | 4h 6m |
| Leeds | 202 km | 16.3 kg | 4h 24m | 92.7 kg | 3h 48m |
| Lisbon | 1,617 km | 52.7 kg | 31h 54m | 407 kg | 5h 42m |
| Liverpool | 213 km | 17.2 kg | 4h 36m | 97.9 kg | 3h 48m |
| Madrid | 1,312 km | 43.2 kg | 18h | 330 kg | 5h 12m |
| Manchester | 189 km | 15.2 kg | 4h 12m | 86.5 kg | 3h 48m |
| Milan | 1,031 km | 34.2 kg | 14h 48m | 259 kg | 4h 54m |
| Munich | 979 km | 33.0 kg | 13h 30m | 246 kg | 4h 48m |
| Newcastle | 331 km | 26.6 kg | 6h 12m | 152 kg | 3h 54m |
| Oslo | 1,127 km | 39.9 kg | 29h 30m | 284 kg | 5h |
| Paris | 417 km | 16.0 kg | 6h 24m | 105 kg | 4h 6m |
| Prague | 1,080 km | 36.4 kg | 19h 54m | 272 kg | 4h 54m |
| Rome | 1,508 km | 48.3 kg | 18h 48m | 379 kg | 5h 30m |
| Sheffield | 157 km | 12.6 kg | 3h 48m | 71.8 kg | 3h 42m |
| Stockholm | 1,424 km | 48.2 kg | 26h 18m | 358 kg | 5h 24m |
| Vienna | 1,290 km | 42.4 kg | 18h 36m | 324 kg | 5h 12m |
| Warsaw | 1,480 km | 48.7 kg | 21h 48m | 372 kg | 5h 30m |
| Zurich | 846 km | 28.8 kg | 11h 48m | 213 kg | 4h 36m |
The year in Milton Keynes
| Jan | Feb | Mar | Apr | May | Jun | Jul | Aug | Sep | Oct | Nov | Dec | |
|---|---|---|---|---|---|---|---|---|---|---|---|---|
| Temp °C | 4.5 | 6.7 | 7.1 | 8.7 | 12.8 | 15.8 | 16.4 | 16.9 | 15.6 | 11.7 | 7.0 | 6.9 |
| Sun h/day | 4.6 | 4.6 | 5.3 | 8.1 | 9.7 | 12.1 | 10.3 | 10.0 | 7.6 | 5.8 | 4.2 | 2.4 |
| Rain mm/day | 1.8 | 1.9 | 3.1 | 2.2 | 2.1 | 1.3 | 2.7 | 1.3 | 3.6 | 2.9 | 2.2 | 2.5 |
When to go
Milton Keynes is warmest in August at 16.9 °C but brightest in June, averaging 12.1 hours of sun a day — the two do not always coincide, which is worth knowing before booking. Its coldest is January at 4.5 °C.
Three months worth booking
The same year of measurements, decided rather than tabulated. Each opens the map below on dates in that month.
Staying there
A hotel room in United Kingdom emits about 10.4 kg CO₂e per night under UK Government 2026 factors — a country average per occupied room, not this or any particular hotel. 7 nights in one room adds roughly 73 kg — about 5.8× the carbon of one person getting there by rail from Sheffield. Two sharing the room halve that share each; the journey does not halve.
Where to stay in Milton Keynes
Places to stay in Milton Keynes, United Kingdom, on a live map. Prices and availability come from Stay22 and its booking partners.
Search places to stay in Milton Keynes →Opens the booking search in a new tab. Same partners as the map below.
Affiliate disclosure. A booking made through this map may earn 0xCarbon a commission, at no extra cost to you. It changes nothing above it: the emissions figures come from UK Government conversion factors and are computed before anyone is paid anything.See the method.
Distances are great-circle. Rail assumes international rail at 0.01135 kg CO₂e per passenger-km with a 1.3× track detour allowance; flights use 0.12576 kg per passenger-km including radiative forcing. Journey times are modelled, not timetabled. Full method.