Kotka

Reaching Kotka from London emits 57.1 kg CO₂e return by rail (37h 30m each way) against 487 kg by air — 9× the carbon. It averages 17.9 °C in August and -4.9 °C in January.
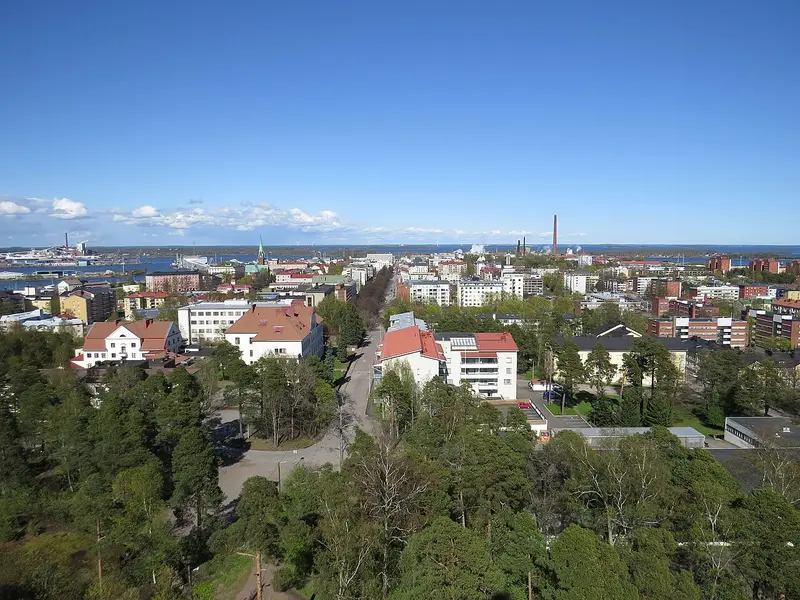
Kotka is the southeasternmost major city in Finland, an important port at the mouth of the Kymi river (Kymenjoki). — Wikivoyage, CC BY-SA 4.0
When to go: Kotka is warmest in August (17.9 °C), sunniest in June (16.1 h a day); coldest in January (-4.9 °C). Month by month
Getting there
| From | Distance | By rail | Rail time | By air | Air time |
|---|---|---|---|---|---|
| Amsterdam | 1,616 km | 47.7 kg | 33h 30m | 406 kg | 5h 42m |
| Barcelona | 2,708 km | 79.9 kg | 43h 18m | 681 kg | 7h 6m |
| Berlin | 1,208 km | 35.6 kg | 28h | 304 kg | 5h 6m |
| Birmingham | 1,960 km | 70.2 kg | 40h 18m | 493 kg | 6h 6m |
| Bristol | 2,069 km | 70.9 kg | 40h 30m | 520 kg | 6h 18m |
| Brussels | 1,761 km | 52.0 kg | 33h 48m | 443 kg | 5h 48m |
| Cardiff | 2,098 km | 74.1 kg | 40h 48m | 528 kg | 6h 18m |
| Copenhagen | 996 km | 29.4 kg | 19h 54m | 251 kg | 4h 48m |
| Dublin | 2,138 km | — | — | 538 kg | 6h 24m |
| Edinburgh | 1,818 km | 100 kg | 43h 18m | 457 kg | 5h 54m |
| Frankfurt | 1,621 km | 47.8 kg | 30h 30m | 408 kg | 5h 42m |
| Glasgow | 1,880 km | 102 kg | 43h 24m | 473 kg | 6h |
| Leeds | 1,854 km | 79.0 kg | 41h 6m | 466 kg | 6h |
| Lisbon | 3,473 km | 103 kg | 60h 48m | 874 kg | 8h 6m |
| Liverpool | 1,956 km | 80.2 kg | 41h 6m | 492 kg | 6h 6m |
| London | 1,936 km | 57.1 kg | 37h 30m | 487 kg | 6h 6m |
| Madrid | 3,058 km | 90.3 kg | 46h 54m | 769 kg | 7h 36m |
| Manchester | 1,911 km | 78.2 kg | 41h | 481 kg | 6h |
| Milan | 2,034 km | 60.0 kg | 40h 54m | 512 kg | 6h 12m |
| Munich | 1,686 km | 49.8 kg | 33h | 424 kg | 5h 42m |
| Newcastle | 1,786 km | 89.1 kg | 41h 48m | 449 kg | 5h 54m |
| Nottingham | 1,888 km | 71.2 kg | 40h 36m | 475 kg | 6h |
| Oslo | 895 km | 26.4 kg | 20h 36m | 225 kg | 4h 42m |
| Paris | 2,021 km | 59.6 kg | 35h 12m | 508 kg | 6h 12m |
| Prague | 1,395 km | 41.2 kg | 34h 24m | 351 kg | 5h 24m |
| Rome | 2,286 km | 67.5 kg | 44h 54m | 575 kg | 6h 30m |
| Sheffield | 1,876 km | 75.4 kg | 40h 54m | 472 kg | 6h |
| Southampton | 2,047 km | 66.1 kg | 40h 12m | 515 kg | 6h 12m |
| Stockholm | 511 km | 15.1 kg | 14h 6m | 128 kg | 4h 12m |
| Vienna | 1,521 km | 44.9 kg | 32h 54m | 383 kg | 5h 30m |
| Warsaw | 985 km | 29.1 kg | 25h 18m | 248 kg | 4h 48m |
| Zurich | 1,877 km | 55.4 kg | 36h 30m | 472 kg | 6h |
The year in Kotka
| Jan | Feb | Mar | Apr | May | Jun | Jul | Aug | Sep | Oct | Nov | Dec | |
|---|---|---|---|---|---|---|---|---|---|---|---|---|
| Temp °C | -4.9 | -3.8 | -1.1 | 3.5 | 11.1 | 16.5 | 17.7 | 17.9 | 15.7 | 6.8 | 1.6 | -1.9 |
| Sun h/day | 1.5 | 3.1 | 5.4 | 9.4 | 14.6 | 16.1 | 13.6 | 12.0 | 9.0 | 5.3 | 1.7 | 0.9 |
| Rain mm/day | 2.3 | 1.9 | 2.0 | 1.7 | 0.7 | 1.3 | 3.1 | 2.4 | 2.7 | 2.8 | 2.8 | 2.8 |
| Sea °C | 0.9 | 0.3 | 0.2 | 1.3 | 6.8 | 14.4 | 17.2 | 19.1 | 17.7 | 12.9 | 7.7 | 4.5 |
When to go
Kotka is warmest in August at 17.9 °C but brightest in June, averaging 16.1 hours of sun a day — the two do not always coincide, which is worth knowing before booking. Its coldest is January at -4.9 °C.
Three months worth booking
The same year of measurements, decided rather than tabulated. Each opens the map below on dates in that month.
Where to stay in Kotka
Places to stay in Kotka, Finland, on a live map. Prices and availability come from Stay22 and its booking partners.
Search places to stay in Kotka →Opens the booking search in a new tab. Same partners as the map below.
Affiliate disclosure. A booking made through this map may earn 0xCarbon a commission, at no extra cost to you. It changes nothing above it: the emissions figures come from UK Government conversion factors and are computed before anyone is paid anything.See the method.
Distances are great-circle. Rail assumes international rail at 0.01135 kg CO₂e per passenger-km with a 1.3× track detour allowance; flights use 0.12576 kg per passenger-km including radiative forcing. Journey times are modelled, not timetabled. Full method.