Kalmar
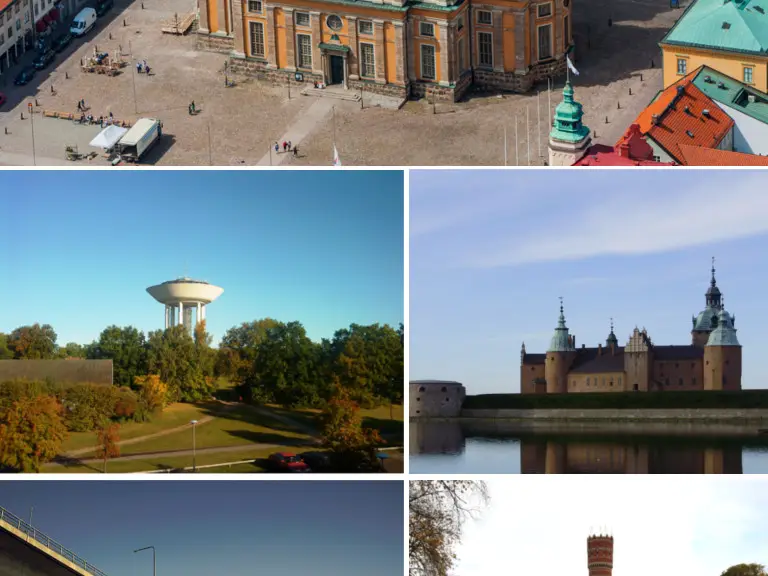

Reaching Kalmar from London emits 35.9 kg CO₂e return by rail (19h 48m each way) against 305 kg by air — 9× the carbon. It averages 17.4 °C in August and 1.0 °C in January.
Kalmar is a city in the Småland province in southeastern Sweden, on the coast of the Baltic sea. — Wikivoyage, CC BY-SA 4.0
When to go: Kalmar is warmest in August (17.4 °C), sunniest in May (14.1 h a day); coldest in January (1.0 °C). Month by month
Getting there
| From | Distance | By rail | Rail time | By air | Air time |
|---|---|---|---|---|---|
| Amsterdam | 879 km | 25.9 kg | 14h 42m | 221 kg | 4h 42m |
| Barcelona | 1,980 km | 58.4 kg | 26h 36m | 498 kg | 6h 6m |
| Berlin | 498 km | 14.7 kg | 9h 12m | 125 kg | 4h 12m |
| Birmingham | 1,261 km | 48.9 kg | 22h 36m | 317 kg | 5h 12m |
| Bristol | 1,360 km | 49.6 kg | 22h 48m | 342 kg | 5h 18m |
| Brussels | 1,018 km | 30.0 kg | 16h 42m | 256 kg | 4h 54m |
| Cardiff | 1,393 km | 52.8 kg | 23h 6m | 350 kg | 5h 24m |
| Copenhagen | 259 km | 7.7 kg | 5h 42m | 65.2 kg | 3h 48m |
| Dublin | 1,481 km | — | — | 373 kg | 5h 30m |
| Edinburgh | 1,205 km | 78.7 kg | 25h 36m | 303 kg | 5h 6m |
| Frankfurt | 887 km | 26.2 kg | 13h 54m | 223 kg | 4h 42m |
| Glasgow | 1,272 km | 80.5 kg | 25h 42m | 320 kg | 5h 12m |
| Leeds | 1,176 km | 57.7 kg | 23h 24m | 296 kg | 5h 6m |
| Lisbon | 2,730 km | 80.6 kg | 41h 24m | 687 kg | 7h 6m |
| Liverpool | 1,279 km | 58.9 kg | 23h 24m | 322 kg | 5h 12m |
| London | 1,214 km | 35.9 kg | 19h 48m | 305 kg | 5h 6m |
| Madrid | 2,315 km | 68.3 kg | 30h 12m | 582 kg | 6h 36m |
| Manchester | 1,231 km | 56.9 kg | 23h 18m | 310 kg | 5h 6m |
| Milan | 1,340 km | 39.6 kg | 21h 18m | 337 kg | 5h 18m |
| Munich | 1,001 km | 29.5 kg | 13h 36m | 252 kg | 4h 48m |
| Newcastle | 1,135 km | 67.8 kg | 24h 6m | 286 kg | 5h |
| Nottingham | 1,192 km | 49.9 kg | 22h 54m | 300 kg | 5h 6m |
| Oslo | 488 km | 14.4 kg | 9h | 123 kg | 4h 12m |
| Paris | 1,277 km | 37.7 kg | 18h 30m | 321 kg | 5h 12m |
| Prague | 742 km | 21.9 kg | 12h 42m | 187 kg | 4h 30m |
| Rome | 1,665 km | 49.1 kg | 24h 48m | 419 kg | 5h 42m |
| Sheffield | 1,189 km | 54.1 kg | 23h 12m | 299 kg | 5h 6m |
| Southampton | 1,326 km | 44.8 kg | 22h 30m | 334 kg | 5h 18m |
| Stockholm | 313 km | 9.2 kg | 6h | 78.8 kg | 3h 54m |
| Vienna | 940 km | 27.7 kg | 15h 36m | 236 kg | 4h 48m |
| Warsaw | 577 km | 17.0 kg | 9h 48m | 145 kg | 4h 18m |
| Zurich | 1,162 km | 34.3 kg | 18h 18m | 292 kg | 5h |
The year in Kalmar
| Jan | Feb | Mar | Apr | May | Jun | Jul | Aug | Sep | Oct | Nov | Dec | |
|---|---|---|---|---|---|---|---|---|---|---|---|---|
| Temp °C | 1.0 | 2.1 | 3.1 | 5.9 | 12.8 | 16.6 | 17.3 | 17.4 | 15.6 | 9.6 | 4.1 | 2.4 |
| Sun h/day | 2.6 | 3.9 | 5.7 | 9.2 | 14.1 | 14.0 | 13.0 | 10.0 | 9.1 | 5.1 | 3.2 | 1.5 |
| Rain mm/day | 2.3 | 1.5 | 1.2 | 1.0 | 0.6 | 3.4 | 3.2 | 2.2 | 1.4 | 2.7 | 0.9 | 1.5 |
| Sea °C | 3.2 | 2.7 | 2.9 | 4.6 | 9.2 | 14.6 | 15.5 | 15.7 | 15.2 | 11.1 | 7.6 | 4.4 |
When to go
Kalmar is warmest in August at 17.4 °C but brightest in May, averaging 14.1 hours of sun a day — the two do not always coincide, which is worth knowing before booking. Its coldest is January at 1.0 °C.
Three months worth booking
The same year of measurements, decided rather than tabulated. Each opens the map below on dates in that month.
Where to stay in Kalmar
Places to stay in Kalmar, Sweden, on a live map. Prices and availability come from Stay22 and its booking partners.
Search places to stay in Kalmar →Opens the booking search in a new tab. Same partners as the map below.
Affiliate disclosure. A booking made through this map may earn 0xCarbon a commission, at no extra cost to you. It changes nothing above it: the emissions figures come from UK Government conversion factors and are computed before anyone is paid anything.See the method.
Distances are great-circle. Rail assumes international rail at 0.01135 kg CO₂e per passenger-km with a 1.3× track detour allowance; flights use 0.12576 kg per passenger-km including radiative forcing. Journey times are modelled, not timetabled. Full method.