Elsinore
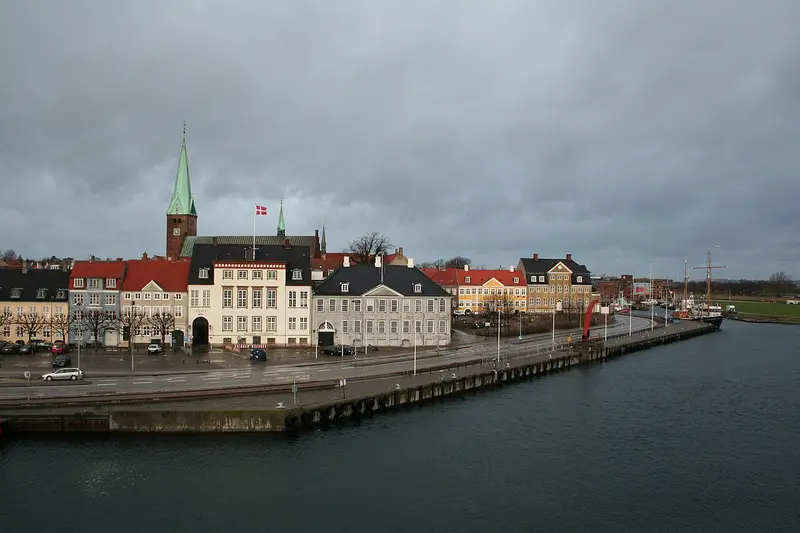

Reaching Elsinore from London emits 28.8 kg CO₂e return by rail (16h 24m each way) against 245 kg by air — 9× the carbon. It averages 17.3 °C in August and 1.9 °C in January.
Elsinore or Helsingør (Danish: Helsingør) is a city of just under 50,000 residents, in the north eastern corner of the island of Zealand in Denmark. — Wikivoyage, CC BY-SA 4.0
When to go: Elsinore is warmest in August (17.3 °C), sunniest in May (14.0 h a day); coldest in January (1.9 °C). Month by month
Getting there
| From | Distance | By rail | Rail time | By air | Air time |
|---|---|---|---|---|---|
| Amsterdam | 646 km | 19.1 kg | 11h 18m | 163 kg | 4h 24m |
| Barcelona | 1,796 km | 53.0 kg | 23h 18m | 452 kg | 5h 54m |
| Berlin | 394 km | 11.6 kg | 7h 42m | 99.1 kg | 4h |
| Birmingham | 1,020 km | 41.8 kg | 19h 12m | 257 kg | 4h 54m |
| Bristol | 1,119 km | 42.5 kg | 19h 24m | 282 kg | 5h |
| Brussels | 794 km | 23.4 kg | 13h 30m | 200 kg | 4h 36m |
| Cardiff | 1,152 km | 45.8 kg | 19h 42m | 290 kg | 5h |
| Dublin | 1,245 km | — | — | 313 kg | 5h 12m |
| Edinburgh | 981 km | 71.7 kg | 22h 12m | 247 kg | 4h 48m |
| Frankfurt | 708 km | 20.9 kg | 10h 54m | 178 kg | 4h 24m |
| Glasgow | 1,048 km | 73.4 kg | 22h 18m | 264 kg | 4h 54m |
| Leeds | 937 km | 50.6 kg | 20h | 236 kg | 4h 42m |
| Lisbon | 2,506 km | 73.9 kg | 38h 6m | 630 kg | 6h 48m |
| Liverpool | 1,040 km | 51.8 kg | 20h | 262 kg | 4h 54m |
| London | 975 km | 28.8 kg | 16h 24m | 245 kg | 4h 48m |
| Madrid | 2,104 km | 62.1 kg | 26h 54m | 529 kg | 6h 18m |
| Manchester | 992 km | 49.8 kg | 19h 54m | 250 kg | 4h 48m |
| Milan | 1,200 km | 35.4 kg | 19h 18m | 302 kg | 5h 6m |
| Munich | 881 km | 26.0 kg | 12h 6m | 222 kg | 4h 42m |
| Newcastle | 902 km | 60.8 kg | 20h 42m | 227 kg | 4h 42m |
| Nottingham | 951 km | 42.9 kg | 19h 30m | 239 kg | 4h 48m |
| Oslo | 445 km | 13.1 kg | 8h 24m | 112 kg | 4h 6m |
| Paris | 1,057 km | 31.2 kg | 15h 12m | 266 kg | 4h 54m |
| Prague | 672 km | 19.8 kg | 11h 42m | 169 kg | 4h 24m |
| Rome | 1,573 km | 46.4 kg | 22h 48m | 396 kg | 5h 36m |
| Sheffield | 949 km | 47.1 kg | 19h 48m | 239 kg | 4h 48m |
| Southampton | 1,086 km | 37.7 kg | 19h 6m | 273 kg | 4h 54m |
| Stockholm | 489 km | 14.4 kg | 7h 48m | 123 kg | 4h 12m |
| Vienna | 907 km | 26.8 kg | 15h 6m | 228 kg | 4h 42m |
| Warsaw | 691 km | 20.4 kg | 11h 42m | 174 kg | 4h 24m |
| Zurich | 1,003 km | 29.6 kg | 16h 30m | 252 kg | 4h 48m |
The year in Elsinore
| Jan | Feb | Mar | Apr | May | Jun | Jul | Aug | Sep | Oct | Nov | Dec | |
|---|---|---|---|---|---|---|---|---|---|---|---|---|
| Temp °C | 1.9 | 3.3 | 4.3 | 7.2 | 13.5 | 16.4 | 16.9 | 17.3 | 16.3 | 10.7 | 5.5 | 3.8 |
| Sun h/day | 3.4 | 4.2 | 6.3 | 9.7 | 14.0 | 13.8 | 12.3 | 10.7 | 9.9 | 5.4 | 3.3 | 1.7 |
| Rain mm/day | 2.9 | 2.2 | 2.0 | 1.7 | 0.5 | 1.9 | 3.1 | 4.4 | 1.8 | 3.0 | 2.6 | 2.2 |
| Sea °C | 3.8 | 3.7 | 4.4 | 6.9 | 11.7 | 16.3 | 17.4 | 18.2 | 17.6 | 13.2 | 9.0 | 5.2 |
When to go
Elsinore is warmest in August at 17.3 °C but brightest in May, averaging 14.0 hours of sun a day — the two do not always coincide, which is worth knowing before booking. Its coldest is January at 1.9 °C.
On these lists
Three months worth booking
The same year of measurements, decided rather than tabulated. Each opens the map below on dates in that month.
Where to stay in Elsinore
Places to stay in Elsinore, Denmark, on a live map. Prices and availability come from Stay22 and its booking partners.
Search places to stay in Elsinore →Opens the booking search in a new tab. Same partners as the map below.
Affiliate disclosure. A booking made through this map may earn 0xCarbon a commission, at no extra cost to you. It changes nothing above it: the emissions figures come from UK Government conversion factors and are computed before anyone is paid anything.See the method.
Distances are great-circle. Rail assumes international rail at 0.01135 kg CO₂e per passenger-km with a 1.3× track detour allowance; flights use 0.12576 kg per passenger-km including radiative forcing. Journey times are modelled, not timetabled. Full method.