Cizre
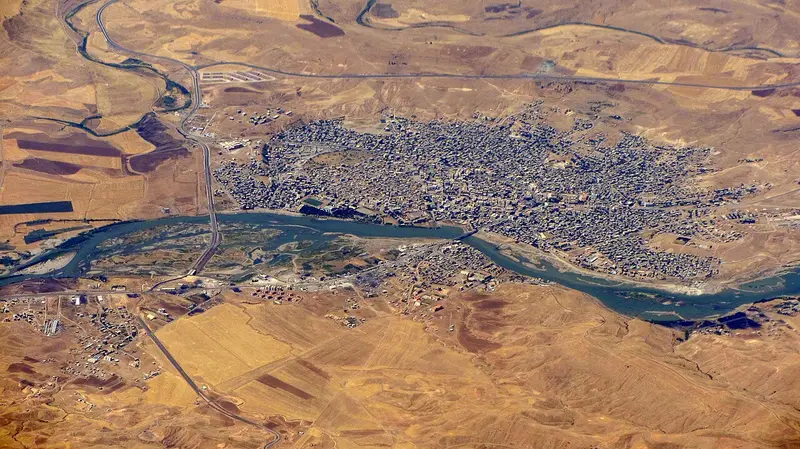

Reaching Cizre from London emits 108 kg CO₂e return by rail (73h 24m each way) against 917 kg by air — 9× the carbon. It averages 34.8 °C in August and 7.3 °C in February.
When to go: Cizre is warmest in August (34.8 °C), sunniest in June (13.6 h a day); coldest in February (7.3 °C). Month by month
Getting there
Travel advice for Turkey. FCDO advises against all travel to within 10km of the border with Syria. gov.uk advice, page updated 22 July 2026; read 2026-09-15. Whether Cizre itself is inside an affected area is not assessed here; check the page before booking.
| From | Distance | By rail | Rail time | By air | Air time |
|---|---|---|---|---|---|
| Amsterdam | 3,330 km | 98.3 kg | 71h 6m | 838 kg | 7h 54m |
| Barcelona | 3,440 km | 102 kg | 76h 12m | 865 kg | 8h 6m |
| Berlin | 2,795 km | 82.5 kg | 64h 12m | 703 kg | 7h 12m |
| Birmingham | 3,783 km | 121 kg | 76h 12m | 886 kg | 8h 30m |
| Bristol | 3,815 km | 121 kg | 76h 24m | 893 kg | 8h 36m |
| Brussels | 3,327 km | 98.2 kg | 70h 54m | 837 kg | 7h 54m |
| Cardiff | 3,856 km | 125 kg | 76h 42m | 903 kg | 8h 36m |
| Copenhagen | 3,008 km | 88.8 kg | 72h 18m | 757 kg | 7h 30m |
| Dublin | 4,084 km | — | — | 956 kg | 8h 54m |
| Edinburgh | 3,936 km | 151 kg | 79h 12m | 921 kg | 8h 42m |
| Frankfurt | 3,009 km | 88.8 kg | 66h 48m | 757 kg | 7h 30m |
| Glasgow | 3,999 km | 152 kg | 79h 18m | 936 kg | 8h 48m |
| Leeds | 3,785 km | 130 kg | 77h | 886 kg | 8h 30m |
| Lisbon | 4,439 km | 131 kg | 93h 42m | 1,039 kg | 9h 24m |
| Liverpool | 3,870 km | 131 kg | 77h | 906 kg | 8h 42m |
| London | 3,647 km | 108 kg | 73h 24m | 917 kg | 8h 24m |
| Madrid | 3,943 km | 116 kg | 79h 48m | 923 kg | 8h 48m |
| Manchester | 3,823 km | 129 kg | 76h 54m | 895 kg | 8h 36m |
| Milan | 2,874 km | 84.8 kg | 62h 54m | 723 kg | 7h 18m |
| Munich | 2,749 km | 81.1 kg | 62h 12m | 692 kg | 7h 12m |
| Newcastle | 3,815 km | 140 kg | 77h 42m | 893 kg | 8h 36m |
| Nottingham | 3,742 km | 122 kg | 76h 30m | 876 kg | 8h 30m |
| Oslo | 3,351 km | 98.9 kg | 79h 12m | 843 kg | 8h |
| Paris | 3,432 km | 101 kg | 69h 6m | 863 kg | 8h 6m |
| Prague | 2,621 km | 77.3 kg | 62h 12m | 659 kg | 7h |
| Rome | 2,579 km | 76.1 kg | 58h 54m | 649 kg | 6h 54m |
| Sheffield | 3,771 km | 126 kg | 76h 48m | 883 kg | 8h 30m |
| Southampton | 3,726 km | 117 kg | 76h 6m | 872 kg | 8h 30m |
| Stockholm | 2,991 km | 88.3 kg | 72h 42m | 752 kg | 7h 30m |
| Vienna | 2,413 km | 71.2 kg | 57h 6m | 607 kg | 6h 42m |
| Warsaw | 2,337 km | 69.0 kg | 57h 12m | 588 kg | 6h 36m |
| Zurich | 2,952 km | 87.1 kg | 66h 54m | 743 kg | 7h 24m |
The year in Cizre
| Jan | Feb | Mar | Apr | May | Jun | Jul | Aug | Sep | Oct | Nov | Dec | |
|---|---|---|---|---|---|---|---|---|---|---|---|---|
| Temp °C | 7.4 | 7.3 | 12.2 | 17.9 | 21.8 | 31.0 | 34.7 | 34.8 | 29.3 | 20.6 | 13.4 | 9.0 |
| Sun h/day | 6.5 | 8.1 | 8.3 | 10.1 | 11.8 | 13.6 | 13.4 | 12.7 | 11.8 | 9.6 | 8.4 | 7.4 |
| Rain mm/day | 4.7 | 3.5 | 5.6 | 3.4 | 2.1 | 0.0 | 0.0 | 0.0 | 0.1 | 0.3 | 4.2 | 3.0 |
When to go
Cizre is warmest in August at 34.8 °C but brightest in June, averaging 13.6 hours of sun a day — the two do not always coincide, which is worth knowing before booking. Its coldest is February at 7.3 °C.
Three months worth booking
The same year of measurements, decided rather than tabulated. Each opens the map below on dates in that month.
Staying there
A hotel room in Turkey emits about 32.1 kg CO₂e per night under UK Government 2026 factors — a country average per occupied room, not this or any particular hotel. 7 nights in one room adds roughly 225 kg — about 3.3× the carbon of one person getting there by rail from Warsaw. Two sharing the room halve that share each; the journey does not halve.
Where to stay in Cizre
Places to stay in Cizre, Turkey, on a live map. Prices and availability come from Stay22 and its booking partners.
Search places to stay in Cizre →Opens the booking search in a new tab. Same partners as the map below.
Affiliate disclosure. A booking made through this map may earn 0xCarbon a commission, at no extra cost to you. It changes nothing above it: the emissions figures come from UK Government conversion factors and are computed before anyone is paid anything.See the method.
Distances are great-circle. Rail assumes international rail at 0.01135 kg CO₂e per passenger-km with a 1.3× track detour allowance; flights use 0.12576 kg per passenger-km including radiative forcing. Journey times are modelled, not timetabled. Full method.