Bodø
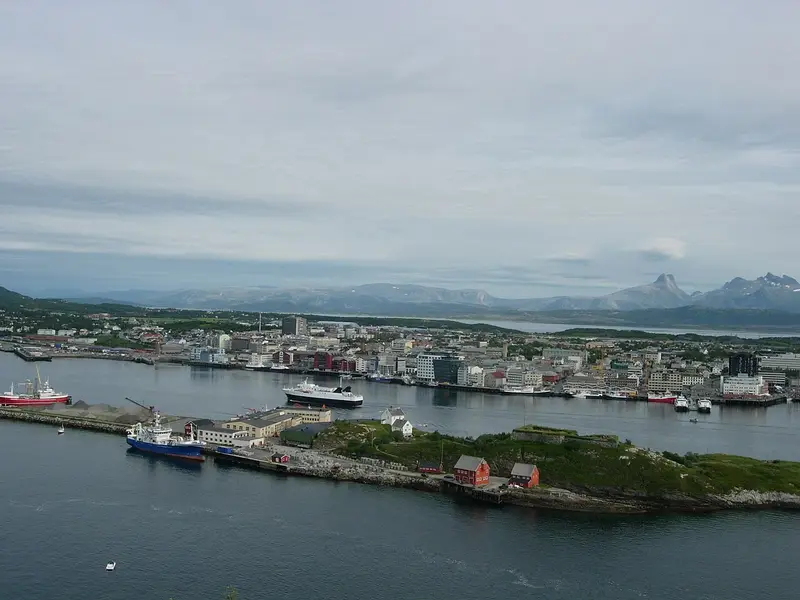

Reaching Bodø from London emits 56.8 kg CO₂e return by rail (32h 12m each way) against 484 kg by air — 9× the carbon. It averages 15.6 °C in July and -4.1 °C in December.
Bodø is the seat of Nordland county in Norway. — Wikivoyage, CC BY-SA 4.0
When to go: Bodø is warmest in July (15.6 °C); coldest in December (-4.1 °C). Month by month
Getting there
| From | Distance | By rail | Rail time | By air | Air time |
|---|---|---|---|---|---|
| Amsterdam | 1,736 km | 51.2 kg | 27h 6m | 437 kg | 5h 48m |
| Barcelona | 2,974 km | 87.7 kg | 39h 6m | 748 kg | 7h 30m |
| Berlin | 1,642 km | 48.5 kg | 25h 42m | 413 kg | 5h 42m |
| Birmingham | 1,866 km | 69.9 kg | 34h 54m | 470 kg | 6h |
| Bristol | 1,990 km | 70.6 kg | 35h 12m | 501 kg | 6h 12m |
| Brussels | 1,909 km | 56.3 kg | 29h 36m | 480 kg | 6h |
| Cardiff | 2,003 km | 73.8 kg | 35h 30m | 504 kg | 6h 12m |
| Copenhagen | 1,294 km | 38.2 kg | 20h 42m | 326 kg | 5h 12m |
| Dublin | 1,903 km | — | — | 479 kg | 6h |
| Edinburgh | 1,553 km | 99.7 kg | 37h 54m | 391 kg | 5h 36m |
| Frankfurt | 1,935 km | 57.1 kg | 28h 30m | 487 kg | 6h 6m |
| Glasgow | 1,594 km | 102 kg | 38h 6m | 401 kg | 5h 36m |
| Leeds | 1,722 km | 78.7 kg | 35h 48m | 433 kg | 5h 48m |
| Lisbon | 3,495 km | 103 kg | 52h 6m | 879 kg | 8h 12m |
| Liverpool | 1,800 km | 79.8 kg | 35h 48m | 453 kg | 5h 54m |
| London | 1,925 km | 56.8 kg | 32h 12m | 484 kg | 6h 6m |
| Madrid | 3,186 km | 94.0 kg | 42h 42m | 801 kg | 7h 42m |
| Manchester | 1,773 km | 77.9 kg | 35h 42m | 446 kg | 5h 54m |
| Milan | 2,445 km | 72.2 kg | 37h 18m | 615 kg | 6h 48m |
| Munich | 2,135 km | 63.0 kg | 30h 6m | 537 kg | 6h 18m |
| Newcastle | 1,605 km | 88.8 kg | 36h 24m | 404 kg | 5h 36m |
| Nottingham | 1,799 km | 70.9 kg | 35h 18m | 453 kg | 5h 54m |
| Oslo | 839 km | 24.7 kg | 13h 36m | 211 kg | 4h 36m |
| Paris | 2,159 km | 63.7 kg | 31h | 543 kg | 6h 24m |
| Prague | 1,912 km | 56.4 kg | 29h 36m | 481 kg | 6h |
| Rome | 2,826 km | 83.4 kg | 40h 48m | 711 kg | 7h 18m |
| Sheffield | 1,763 km | 75.1 kg | 35h 36m | 443 kg | 5h 54m |
| Southampton | 2,018 km | 65.8 kg | 34h 54m | 508 kg | 6h 12m |
| Stockholm | 903 km | 26.6 kg | 15h | 227 kg | 4h 42m |
| Vienna | 2,124 km | 62.7 kg | 32h 42m | 534 kg | 6h 18m |
| Warsaw | 1,712 km | 50.5 kg | 26h 36m | 431 kg | 5h 48m |
| Zurich | 2,240 km | 66.1 kg | 34h 18m | 563 kg | 6h 30m |
The year in Bodø
| Jan | Feb | Mar | Apr | May | Jun | Jul | Aug | Sep | Oct | Nov | Dec | |
|---|---|---|---|---|---|---|---|---|---|---|---|---|
| Temp °C | -3.0 | -1.6 | -3.0 | 2.6 | 8.3 | 12.6 | 15.6 | 15.6 | 10.9 | 4.1 | -1.0 | -4.1 |
| Sun h/day | 0.3 | 2.3 | 7.4 | 8.9 | 9.4 | 11.1 | 12.5 | 9.5 | 5.2 | 3.4 | 1.6 | 0.0 |
| Rain mm/day | 6.9 | 5.2 | 2.8 | 2.1 | 4.4 | 4.8 | 2.5 | 5.2 | 6.6 | 7.4 | 6.3 | 7.8 |
| Sea °C | 5.5 | 4.4 | 4.2 | 4.7 | 6.4 | 10.2 | 13.9 | 15.2 | 13.0 | 10.8 | 8.7 | 6.7 |
When to go
Bodø is warmest in July at 15.6 °C, and that is also its brightest month. Its coldest is December at -4.1 °C.
On these lists
- Coolest from London in June · #3
- Coolest from London in September · #4
- Coolest from London in May · #5
- Coolest from London in March · #7
- Coolest from London in April · #8
- Coolest from London in November · #8
- Coolest from London in December · #8
- Coolest from London in October · #9
Three months worth booking
The same year of measurements, decided rather than tabulated. Each opens the map below on dates in that month.
Where to stay in Bodø
Places to stay in Bodø, Norway, on a live map. Prices and availability come from Stay22 and its booking partners.
Search places to stay in Bodø →Opens the booking search in a new tab. Same partners as the map below.
Affiliate disclosure. A booking made through this map may earn 0xCarbon a commission, at no extra cost to you. It changes nothing above it: the emissions figures come from UK Government conversion factors and are computed before anyone is paid anything.See the method.
Distances are great-circle. Rail assumes international rail at 0.01135 kg CO₂e per passenger-km with a 1.3× track detour allowance; flights use 0.12576 kg per passenger-km including radiative forcing. Journey times are modelled, not timetabled. Full method.